Listen up... fatty... I ain't talking about the kind that you can eat...
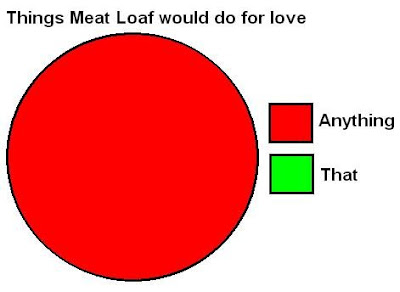
A pie chart (or a circle graph) is a circular chart divided into sectors, illustrating relative magnitudes or frequences or percents. In a pie chart, the arc length of each sector (and consequently its central angle and area), is proportional to the quantity it represents. Together, the sectors create a full disk. It is named for its resemblance to a pie which has been sliced.
Tuesday, January 13, 2009
Sunday, January 11, 2009
Solutions for the lazy pet owners.... (I'm one of them)
While I was starring at my dog lying in his dog bed (not a uncommon sight)... I thought of 3 inventions exactly... unfortunately after 15 minutes of searching on the internet... It has come to my attention that ONCE AGAIN, people have shamelessly stolen my ideas behind my back. Just to add salt to my wound, all 3 of them has posted them on Youtube !!! Internet 37 - Me 0
Labels:
inventions,
lazy,
pets
Subscribe to:
Posts (Atom)